
 Research analytics and impact evaluation is a a core service area in Becker Library’s Research, Publishing and Communication division, which provides a wide variety of customized programs, services, and expertise to assist faculty, investigators, and students in navigating a complex and ever-changing research publishing and biomedical communication landscape.
This area continues to grow in scope and depth in response to faculty’s growing and evolving needs around better quantifying and demonstrating the impact of their research and scholarly outputs. Librarians provide guidance and reports for individuals, groups and divisions in a variety of ways, giving researchers actionable insights as they’re making critical decisions.
HELPING YOU DEMONSTRATE YOUR EXPERTISE
While there was a wide variety of requests from administrators and faculty, some of the most noteworthy and frequent included:
- Demonstrating expertise using publication data; journal impact factor scores; use of various indices such as h, m, v.
- Using publication data to fairly compare the impact of clinicians with scientific investigators.
- Providing guidance on which metrics to use for benchmarking.
- Checking/correcting university name in databases for ranking organization purposes.
- Assisting investigators with strategies for establishing their online profiles.
- Providing guidance on completing tenure packets.
- Recommending ways to enhance the impact of faculty research efforts.
- Identifying metrics to use for benchmarking checking.
HELPING YOU DEMONSTRATE YOUR IMPACT
The depth and variety of evaluation report requests from departments and faculty continued to demonstrate how users are leveraging the library’s expertise to document and summarize the impact of the school’s research outputs. Librarians provided evaluation services and reports to over 30 departments, programs, centers and institutes in FY20.
In addition to reports, graphs, and tables, librarians provided visual networks, co-author network or choropleth geographic maps that display top authors in a specific field, co-author network maps that display collaboration among authors, and word clouds that display topics to demonstrate trends or areas of expertise.
PILOTING INTERACTIVE REPORTING WITH TABLEAU DASHBOARDS
In early 2020, a specialized research group requested assistance in a project to demonstrate the impact of publications from their annual conferences covering a six-year period. To help visualize the impact of the group’s conference publications, librarians created Tableau dashboards using publication and citation data. Six Tableau dashboards were created including a direct citation network analysis visualization. The project is still ongoing but has provided the groundwork for offering enhanced and more interactive reporting capabilities for other groups going forward.
TRANSLATIONAL SCIENCE BENEFITS MODEL
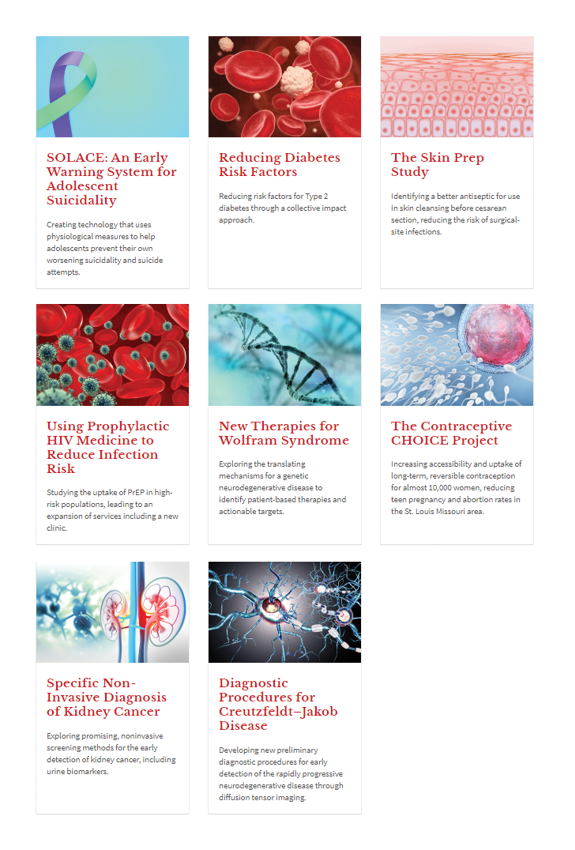
The Translational Science Benefits Model (TSBM), a framework for assessing the health and societal benefits of clinical and translational sciences, was launched in January 2019. Becker librarians, as members of the ICTS Tracking and Evaluation Team, served as the lead for developing case studies used to provide a contextual narrative to illustrate the TSBM. Librarians developed three new case studies added in June 2020 to the three case studies they previously developed in conjunction with the website launch. Other case studies are in progress as well as templates and guidance for case studies.
Other activities as part of the Tracking and Evaluation Team included generating publication reports and citation analysis on 2,700 ICTS members in support of progress reports and renewal applications.

| Previous: Assistance to Authors & Researchers | Next: Health & Science Communication |
| Back to top |